
Convolutional Neural Networks to Detect Vestibular Schwannomas on Single MRI Slices: A Feasibility Study

 , , , , , ,
Abstract
:Simple Summary
Abstract
1. Introduction
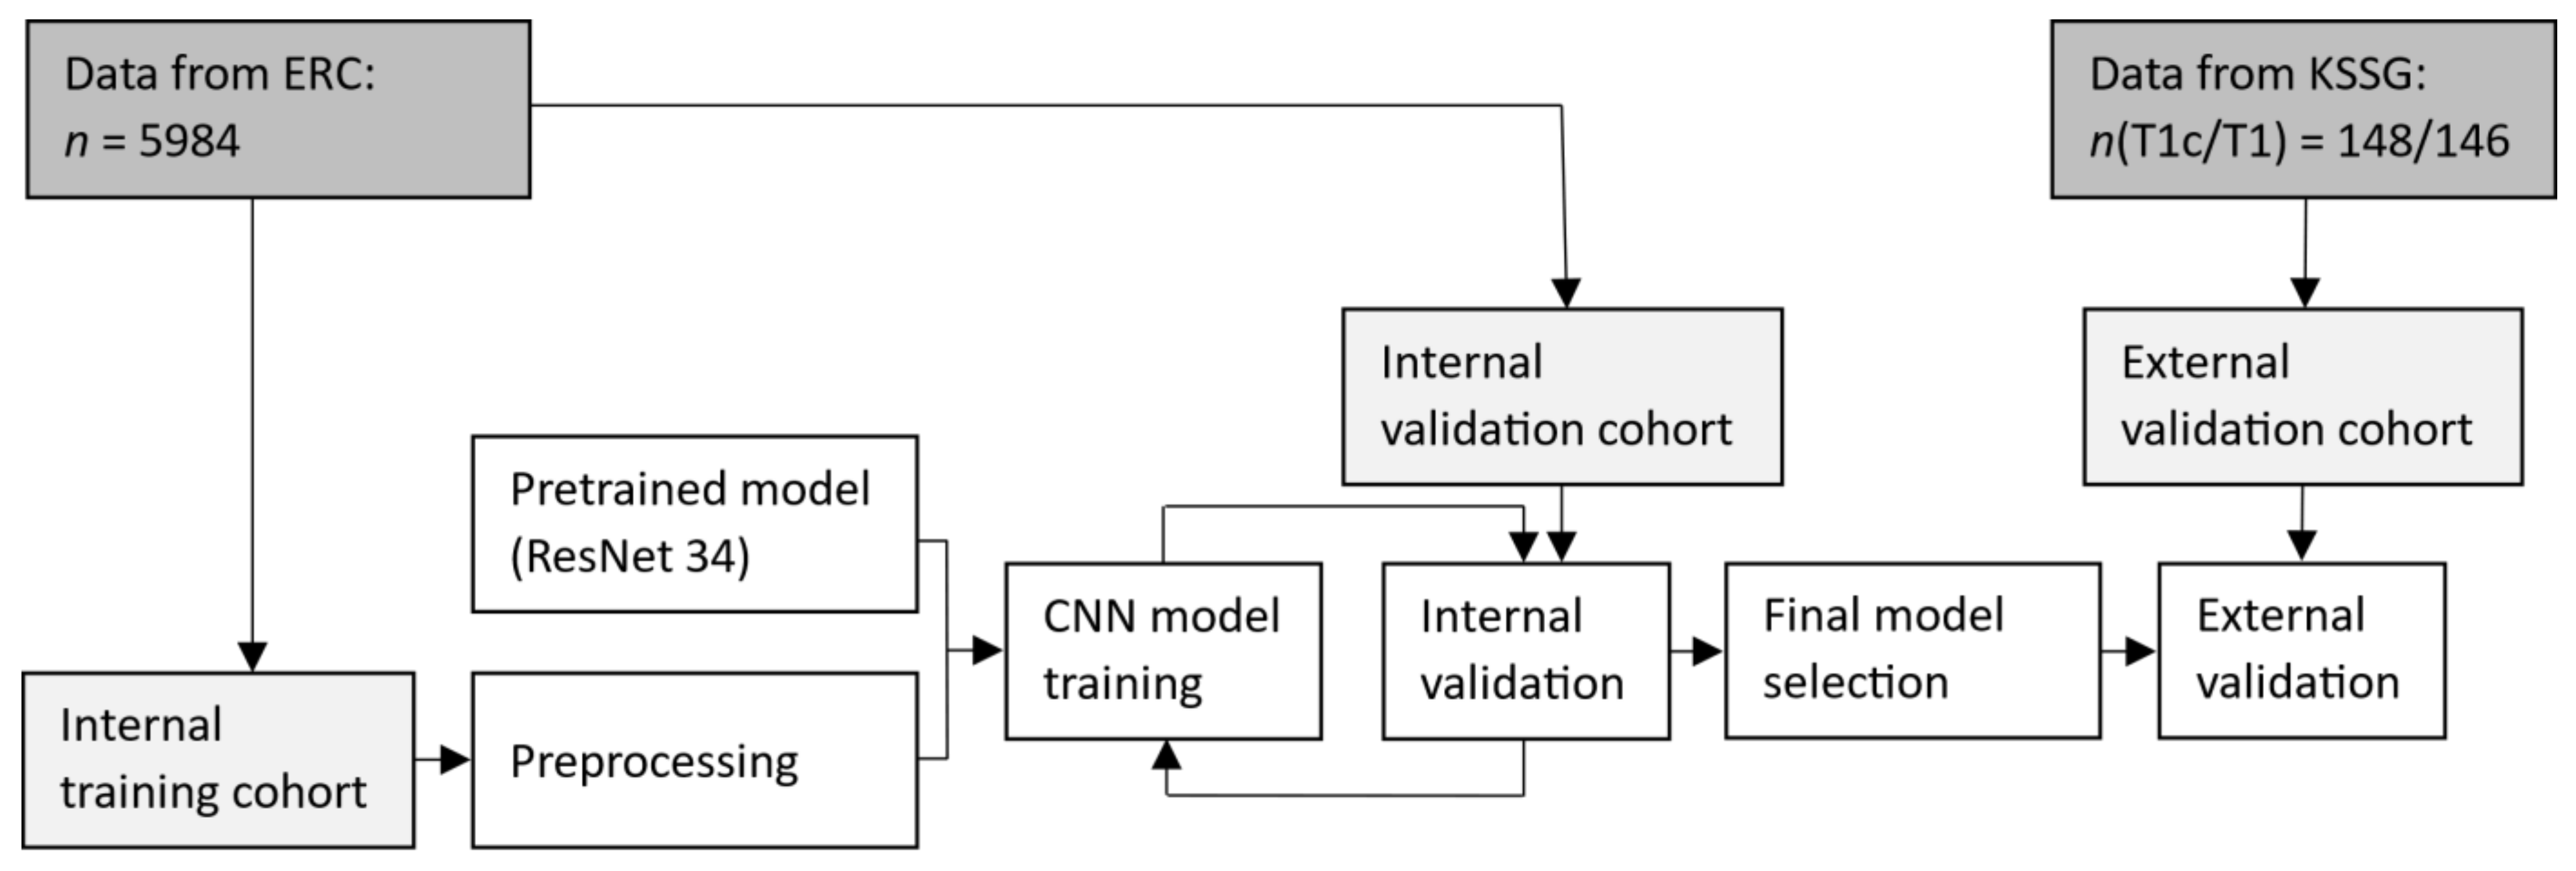
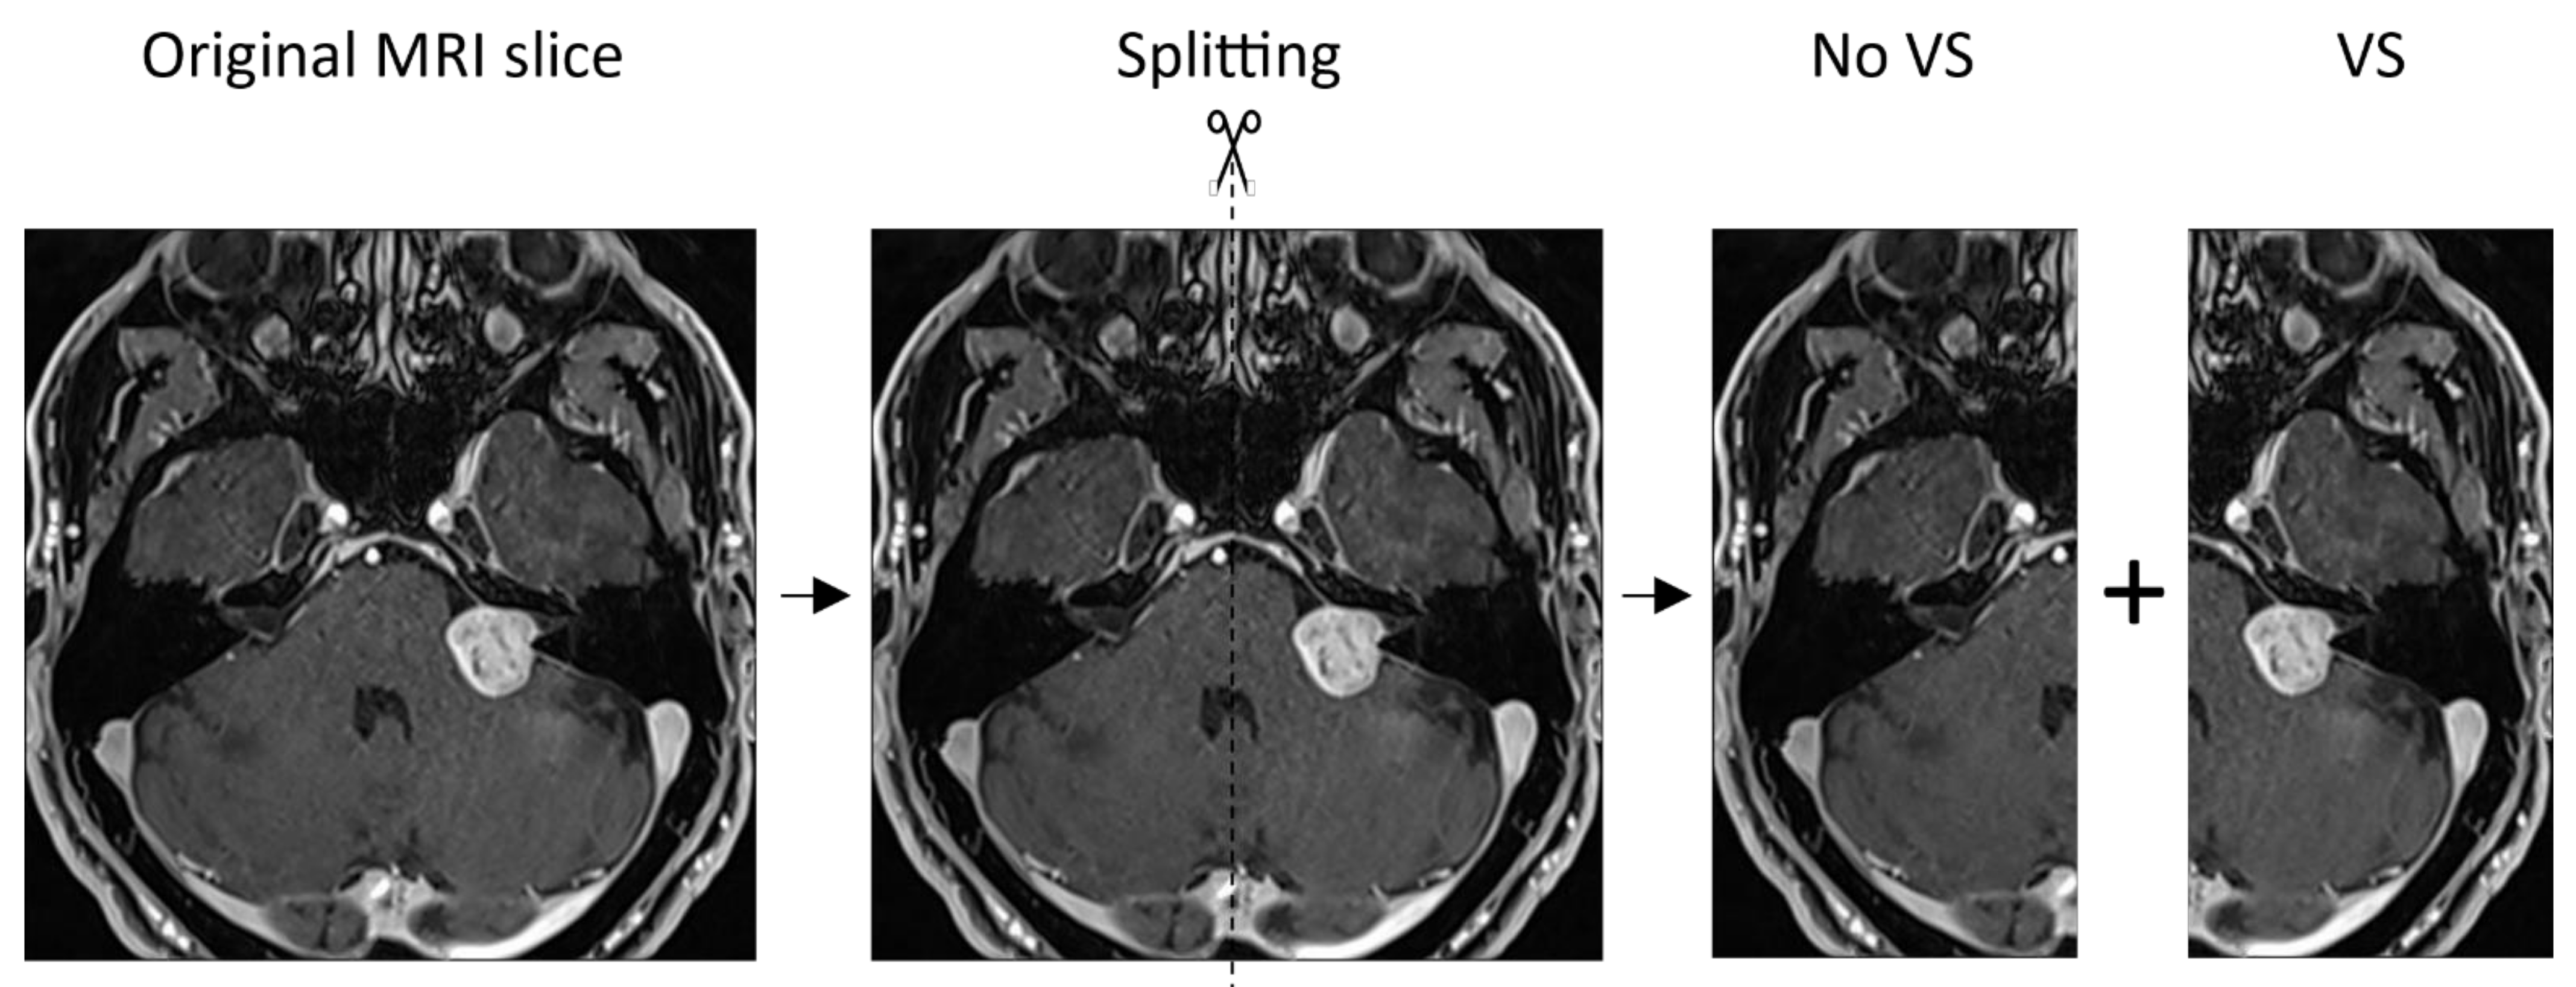
2. Materials and Methods
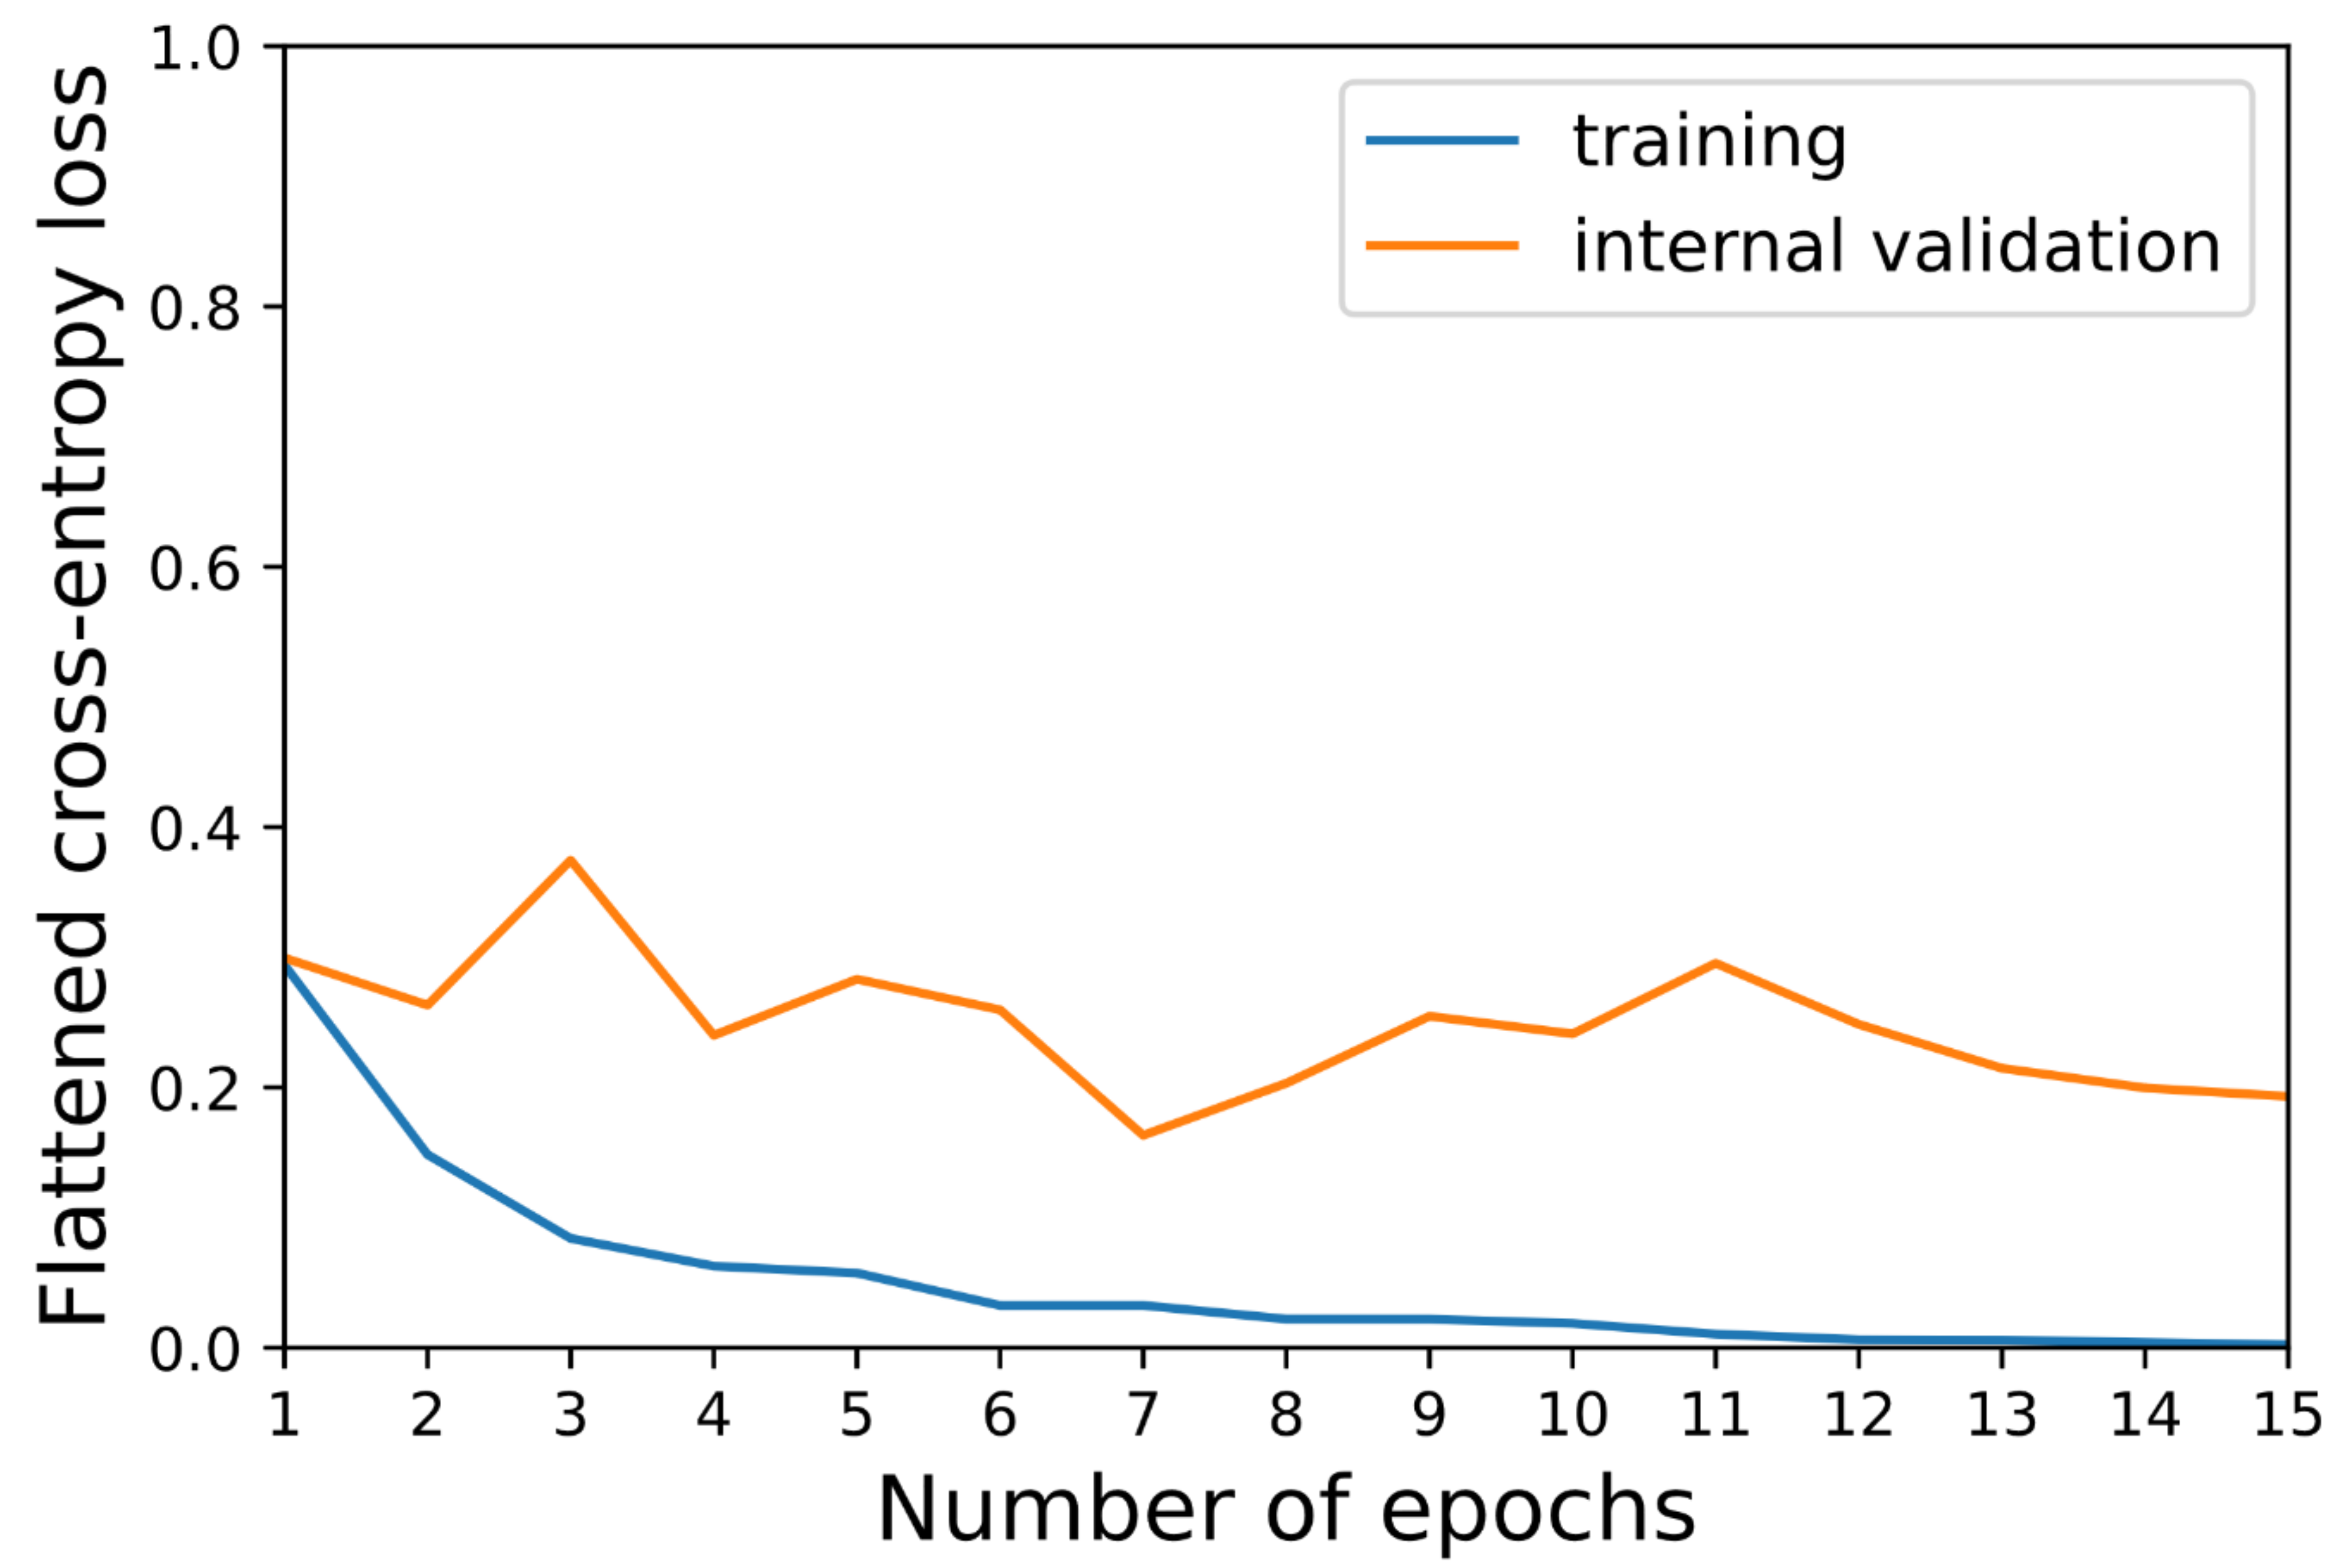
3. Results
4. Discussion
5. Conclusions
Supplementary Materials
Author Contributions
Funding
Institutional Review Board Statement
Informed Consent Statement
Data Availability Statement
Acknowledgments
Conflicts of Interest
References
- Angra, S.; Ahuja, S. Machine Learning and Its Applications: A Review. In Proceedings of the 2017 International Conference on Big Data Analytics and Computational Intelligence (ICBDAC), Chirala, India, 23–25 March 2017; pp. 57–60. [Google Scholar]
- Valliani, A.A.-A.; Ranti, D.; Oermann, E.K. Deep Learning and Neurology: A Systematic Review. Neurol. Ther. 2019, 8, 351–365. [Google Scholar] [CrossRef] [PubMed] [Green Version]
- Tiwari, A.; Srivastava, S.; Pant, M. Brain Tumor Segmentation and Classification from Magnetic Resonance Images: Review of Selected Methods from 2014 to 2019. Pattern Recognit. Lett. 2020, 131, 244–260. [Google Scholar] [CrossRef]
- Ehret, F.; Kaul, D.; Clusmann, H.; Delev, D.; Kernbach, J.M. Machine Learning-Based Radiomics in Neuro-Oncology. Acta Neurochir. Suppl. 2022, 134, 139–151. [Google Scholar] [PubMed]
- Abd-Ellah, M.K.; Awad, A.I.; Khalaf, A.A.M.; Hamed, H.F.A. A Review on Brain Tumor Diagnosis from MRI Images: Practical Implications, Key Achievements, and Lessons Learned. Magn. Reson. Imaging 2019, 61, 300–318. [Google Scholar] [CrossRef]
- Wang, G.; Li, W.; Ourselin, S.; Vercauteren, T. Automatic Brain Tumor Segmentation Based on Cascaded Convolutional Neural Networks With Uncertainty Estimation. Front. Comput. Neurosci. 2019, 13, 56. [Google Scholar] [CrossRef] [Green Version]
- Grøvik, E.; Yi, D.; Iv, M.; Tong, E.; Rubin, D.; Zaharchuk, G. Deep Learning Enables Automatic Detection and Segmentation of Brain Metastases on Multisequence MRI. J. Magn. Reson. Imaging 2020, 51, 175–182. [Google Scholar] [CrossRef] [Green Version]
- Rehman, A.; Khan, M.A.; Saba, T.; Mehmood, Z.; Tariq, U.; Ayesha, N. Microscopic Brain Tumor Detection and Classification Using 3D CNN and Feature Selection Architecture. Microsc. Res. Tech. 2021, 84, 133–149. [Google Scholar] [CrossRef]
- Sharif, M.I.; Li, J.P.; Khan, M.A.; Saleem, M.A. Active Deep Neural Network Features Selection for Segmentation and Recognition of Brain Tumors Using MRI Images. Pattern Recognit. Lett. 2020, 129, 181–189. [Google Scholar] [CrossRef]
- Khan, M.A.; Ashraf, I.; Alhaisoni, M.; Damaševičius, R.; Scherer, R.; Rehman, A.; Bukhari, S.A.C. Multimodal Brain Tumor Classification Using Deep Learning and Robust Feature Selection: A Machine Learning Application for Radiologists. Diagnostics 2020, 10, 565. [Google Scholar] [CrossRef]
- Liu, Z.; Tang, H.; Lin, Y.; Han, S. Point-Voxel CNN for Efficient 3D Deep Learning. arXiv 2019, arXiv:1907.03739. [Google Scholar]
- Zhou, Z.; Sanders, J.W.; Johnson, J.M.; Gule-Monroe, M.K.; Chen, M.M.; Briere, T.M.; Wang, Y.; Son, J.B.; Pagel, M.D.; Li, J.; et al. Computer-Aided Detection of Brain Metastases in T1-Weighted MRI for Stereotactic Radiosurgery Using Deep Learning Single-Shot Detectors. Radiology 2020, 295, 407–415. [Google Scholar] [CrossRef] [PubMed]
- Zhang, M.; Young, G.S.; Chen, H.; Li, J.; Qin, L.; McFaline-Figueroa, J.R.; Reardon, D.A.; Cao, X.; Wu, X.; Xu, X. Deep-Learning Detection of Cancer Metastases to the Brain on MRI. J. Magn. Reson. Imaging 2020, 52, 1227–1236. [Google Scholar] [CrossRef] [PubMed]
- Xu, J.; Li, M.; Zhu, Z. Automatic Data Augmentation for 3D Medical Image Segmentation. In Proceedings of the Medical Image Computing and Computer Assisted Intervention–MICCAI 2020, Lima, Peru, 4–8 October 2020; Springer International Publishing: New York, NY, USA, 2020; pp. 378–387. [Google Scholar]
- Zhang, H.; Cisse, M.; Dauphin, Y.N.; Lopez-Paz, D. Mixup: Beyond Empirical Risk Minimization. arXiv 2017, arXiv:1710.09412. [Google Scholar]
- Kadry, S.; Damaševičius, R.; Taniar, D.; Rajinikanth, V.; Lawal, I.A. Extraction of Tumour in Breast MRI Using Joint Thresholding and Segmentation—A Study. In Proceedings of the 7th International conference on Bio Signals, Images and Instrumentation (ICBSII), Chennai, India, 25–27 March 2021; pp. 1–5. [Google Scholar]
- Kadry, S.; Damaševičius, R.; Taniar, D.; Rajinikanth, V.; Lawal, I.A. U-Net Supported Segmentation of Ischemic-Stroke-Lesion from Brain MRI Slices. In Proceedings of the 7th International conference on Bio Signals, Images, and Instrumentation (ICBSII), Chennai, India, 25–27 March 2021; pp. 1–5. [Google Scholar]
- Rehman, A.; Naz, S.; Razzak, M.I.; Akram, F.; Imran, M. A Deep Learning-Based Framework for Automatic Brain Tumors Classification Using Transfer Learning. Circuits Syst. Signal Process 2020, 39, 757–775. [Google Scholar] [CrossRef]
- Goldbrunner, R.; Weller, M.; Regis, J.; Lund-Johansen, M.; Stavrinou, P.; Reuss, D.; Evans, D.G.; Lefranc, F.; Sallabanda, K.; Falini, A.; et al. EANO Guideline on the Diagnosis and Treatment of Vestibular Schwannoma. Neuro Oncol. 2019, 22, 31–45. [Google Scholar] [CrossRef]
- Sager, P.; Näf, L.; Vu, E.; Fischer, T.; Putora, P.M.; Ehret, F.; Fürweger, C.; Schröder, C.; Förster, R.; Zwahlen, D.R.; et al. Convolutional Neural Networks for Classifying Laterality of Vestibular Schwannomas on Single MRI Slices—A Feasibility Study. Diagnostics 2021, 11, 1676. [Google Scholar] [CrossRef]
- Howard, J.; Gugger, S. Fastai: A Layered API for Deep Learning. Information 2020, 11, 108. [Google Scholar] [CrossRef] [Green Version]
- Paszke, A.; Gross, S.; Massa, F.; Lerer, A.; Bradbury, J.; Chanan, G.; Killeen, T.; Lin, Z.; Gimelshein, N.; Antiga, L.; et al. PyTorch: An Imperative Style, High-Performance Deep Learning Library. In Proceedings of the Advances in Neural Information Processing Systems, Vancouver, BC, Canada, 8–14 December 2019; Wallach, H., Larochelle, H., Beygelzimer, A., Alché-Buc, F., Fox, E., Garnett, R., Eds.; Curran Associates, Inc.: Red Hook, NY, USA, 2019; Volume 32. [Google Scholar]
- Data Augmentation in Computer Vision. Available online: https://docs.fast.ai/vision.augment.html (accessed on 14 November 2021).
- Khan, A.; Sohail, A.; Zahoora, U.; Qureshi, A.S. A Survey of the Recent Architectures of Deep Convolutional Neural Networks. Artif. Intell. Rev. 2020, 53, 5455–5516. [Google Scholar] [CrossRef] [Green Version]
- He, K.; Zhang, X.; Ren, S.; Sun, J. Deep Residual Learning for Image Recognition. In Proceedings of the IEEE Conference on Computer Vision and Pattern Recognition, Las Vegas, NV, USA, 27–30 June 2016; pp. 770–778. [Google Scholar]
- Kingma, D.P.; Ba, J. Adam: A Method for Stochastic Optimization. arXiv 2014, arXiv:1412.6980. [Google Scholar]
- Selvaraju, R.R.; Cogswell, M.; Das, A.; Vedantam, R.; Parikh, D.; Batra, D. Grad-CAM: Visual Explanations from Deep Networks via Gradient-Based Localization. In Proceedings of the IEEE International Conference on Computer Vision, Venice, Italy, 22–29 October 2017; pp. 618–626. [Google Scholar]
- Shapey, J.; Kujawa, A.; Dorent, R.; Saeed, S.R.; Kitchen, N.; Obholzer, R.; Ourselin, S.; Vercauteren, T.; Thomas, N.W.M. Artificial Intelligence Opportunities for Vestibular Schwannoma Management Using Image Segmentation and Clinical Decision Tools. World Neurosurg. 2021, 149, 269–270. [Google Scholar] [CrossRef]
- Lee, C.-C.; Lee, W.-K.; Wu, C.-C.; Lu, C.-F.; Yang, H.-C.; Chen, Y.-W.; Chung, W.-Y.; Hu, Y.-S.; Wu, H.-M.; Wu, Y.-T.; et al. Applying Artificial Intelligence to Longitudinal Imaging Analysis of Vestibular Schwannoma Following Radiosurgery. Sci. Rep. 2021, 11, 3106. [Google Scholar] [CrossRef] [PubMed]
- Lee, W.-K.; Wu, C.-C.; Lee, C.-C.; Lu, C.-F.; Yang, H.-C.; Huang, T.-H.; Lin, C.-Y.; Chung, W.-Y.; Wang, P.-S.; Wu, H.-M.; et al. Combining Analysis of Multi-Parametric MR Images into a Convolutional Neural Network: Precise Target Delineation for Vestibular Schwannoma Treatment Planning. Artif. Intell. Med. 2020, 107, 101911. [Google Scholar] [CrossRef] [PubMed]
- George-Jones, N.A.; Wang, K.; Wang, J.; Hunter, J.B. Automated Detection of Vestibular Schwannoma Growth Using a Two-Dimensional U-Net Convolutional Neural Network. Laryngoscope 2021, 131, E619–E624. [Google Scholar] [CrossRef] [PubMed]
- Shapey, J.; Wang, G.; Dorent, R.; Dimitriadis, A.; Li, W.; Paddick, I.; Kitchen, N.; Bisdas, S.; Saeed, S.R.; Ourselin, S.; et al. An Artificial Intelligence Framework for Automatic Segmentation and Volumetry of Vestibular Schwannomas from Contrast-Enhanced T1-Weighted and High-Resolution T2-Weighted MRI. J. Neurosurg. 2019, 134, 171–179. [Google Scholar] [CrossRef]
- Beyea, J.A.; Newsted, D.; Campbell, R.J.; Nguyen, P.; Alkins, R.D. Response To Letter To The Editor: “Artificial Intelligence and Decision-Making For Vestibular Schwannoma Surgery”. Otol. Neurotol. 2022, 43, e132–e133. [Google Scholar] [CrossRef]
- Risbud, A.; Tsutsumi, K.; Abouzari, M. Artificial Intelligence and Decision-Making for Vestibular Schwannoma Surgery. Otol. Neurotol. 2022, 43, e131–e132. [Google Scholar] [CrossRef]
- Dang, S.; Manzoor, N.F.; Chowdhury, N.; Tittman, S.M.; Yancey, K.L.; Monsour, M.A.; O’Malley, M.R.; Rivas, A.; Haynes, D.S.; Bennett, M.L. Investigating Predictors of Increased Length of Stay After Resection of Vestibular Schwannoma Using Machine Learning. Otol. Neurotol. 2021, 42, e584–e592. [Google Scholar] [CrossRef]
- Cha, D.; Shin, S.H.; Kim, S.H.; Choi, J.Y.; Moon, I.S. Machine Learning Approach for Prediction of Hearing Preservation in Vestibular Schwannoma Surgery. Sci. Rep. 2020, 10, 7136. [Google Scholar] [CrossRef]
- Abouzari, M.; Goshtasbi, K.; Sarna, B.; Khosravi, P.; Reutershan, T.; Mostaghni, N.; Lin, H.W.; Djalilian, H.R. Prediction of Vestibular Schwannoma Recurrence Using Artificial Neural Network. Laryngoscope Investig. Otolaryngol. 2020, 5, 278–285. [Google Scholar] [CrossRef] [Green Version]
- Profant, O.; Bureš, Z.; Balogová, Z.; Betka, J.; Fík, Z.; Chovanec, M.; Voráček, J. Decision Making on Vestibular Schwannoma Treatment: Predictions Based on Machine-Learning Analysis. Sci. Rep. 2021, 11, 18376. [Google Scholar] [CrossRef]
- Song, D.; Zhai, Y.; Tao, X.; Zhao, C.; Wang, M.; Wei, X. Prediction of Blood Supply in Vestibular Schwannomas Using Radiomics Machine Learning Classifiers. Sci. Rep. 2021, 11, 18872. [Google Scholar] [CrossRef] [PubMed]
- Huang, C.-Y.; Peng, S.-J.; Wu, H.-M.; Yang, H.-C.; Chen, C.-J.; Wang, M.-C.; Hu, Y.-S.; Chen, Y.-W.; Lin, C.-J.; Guo, W.-Y.; et al. Quantification of Tumor Response of Cystic Vestibular Schwannoma to Gamma Knife Radiosurgery by Using Artificial Intelligence. J. Neurosurg. 2021, 1–9. [Google Scholar] [CrossRef] [PubMed]
- Huang, Q.; Zhai, S.-J.; Liao, X.-W.; Liu, Y.-C.; Yin, S.-H. Gene Expression, Network Analysis, and Drug Discovery of Neurofibromatosis Type 2-Associated Vestibular Schwannomas Based on Bioinformatics Analysis. J. Oncol. 2020, 2020, 5976465. [Google Scholar] [CrossRef] [PubMed]
- Sass, H.C.R.; Borup, R.; Alanin, M.; Nielsen, F.C.; Cayé-Thomasen, P. Gene Expression, Signal Transduction Pathways and Functional Networks Associated with Growth of Sporadic Vestibular Schwannomas. J. Neurooncol. 2017, 131, 283–292. [Google Scholar] [CrossRef] [PubMed]
- Agnihotri, S.; Gugel, I.; Remke, M.; Bornemann, A.; Pantazis, G.; Mack, S.C.; Shih, D.; Singh, S.K.; Sabha, N.; Taylor, M.D.; et al. Gene-Expression Profiling Elucidates Molecular Signaling Networks That Can Be Therapeutically Targeted in Vestibular Schwannoma. J. Neurosurg. 2014, 121, 1434–1445. [Google Scholar] [CrossRef] [PubMed] [Green Version]
- Killeen, D.E.; Isaacson, B. Deep Venous Thrombosis Chemoprophylaxis in Lateral Skull Base Surgery for Vestibular Schwannoma. Laryngoscope 2020, 130, 1851–1853. [Google Scholar] [CrossRef] [PubMed] [Green Version]
- Kundu, S. AI in Medicine Must Be Explainable. Nat. Med. 2021, 27, 1328. [Google Scholar] [CrossRef]
- Windisch, P.; Weber, P.; Fürweger, C.; Ehret, F.; Kufeld, M.; Zwahlen, D.; Muacevic, A. Implementation of Model Explainability for a Basic Brain Tumor Detection Using Convolutional Neural Networks on MRI Slices. Neuroradiology 2020, 62, 1515–1518. [Google Scholar] [CrossRef]
- Kim, D.W.; Jang, H.Y.; Kim, K.W.; Shin, Y.; Park, S.H. Design Characteristics of Studies Reporting the Performance of Artificial Intelligence Algorithms for Diagnostic Analysis of Medical Images: Results from Recently Published Papers. Korean J. Radiol. 2019, 20, 405–410. [Google Scholar] [CrossRef]
- Windisch, P.Y.; Tonn, J.-C.; Fürweger, C.; Wowra, B.; Kufeld, M.; Schichor, C.; Muacevic, A. Clinical Results After Single-Fraction Radiosurgery for 1,002 Vestibular Schwannomas. Cureus 2019, 11, e6390. [Google Scholar] [CrossRef] [Green Version]
- Starke, S.; Leger, S.; Zwanenburg, A.; Leger, K.; Lohaus, F.; Linge, A.; Schreiber, A.; Kalinauskaite, G.; Tinhofer, I.; Guberina, N.; et al. 2D and 3D Convolutional Neural Networks for Outcome Modelling of Locally Advanced Head and Neck Squamous Cell Carcinoma. Sci. Rep. 2020, 10, 15625. [Google Scholar] [CrossRef] [PubMed]


| Characteristics | Training (T1c) | Internal Validation (T1c) | External Validation (T1c) | External Validation (T1) |
|---|---|---|---|---|
| Number of patients | 539 | 94 | 74 | 73 |
| Number of MRI slices/bisected MRI slices | 2538/5076 | 454/908 | 74/148 | 73/146 |
| Tumor location | ||||
| Left (number of patients/MRI slices/bisected MRI slices) | 278/1307/2614 | 54/270/540 | 31/31/62 | 34/39/78 |
| Right (number of patients/MRI slices/bisected MRI slices) | 261/1231/2462 | 40/184/368 | 43/43/86 | 39/39/78 |
| Data Set | Accuracy (95% CI) | Sensitivity | Specificity | F1 Score |
|---|---|---|---|---|
| Internal validation | 0.949 (95% CI 0.935–0.963) | 0.916 | 0.982 | 0.948 |
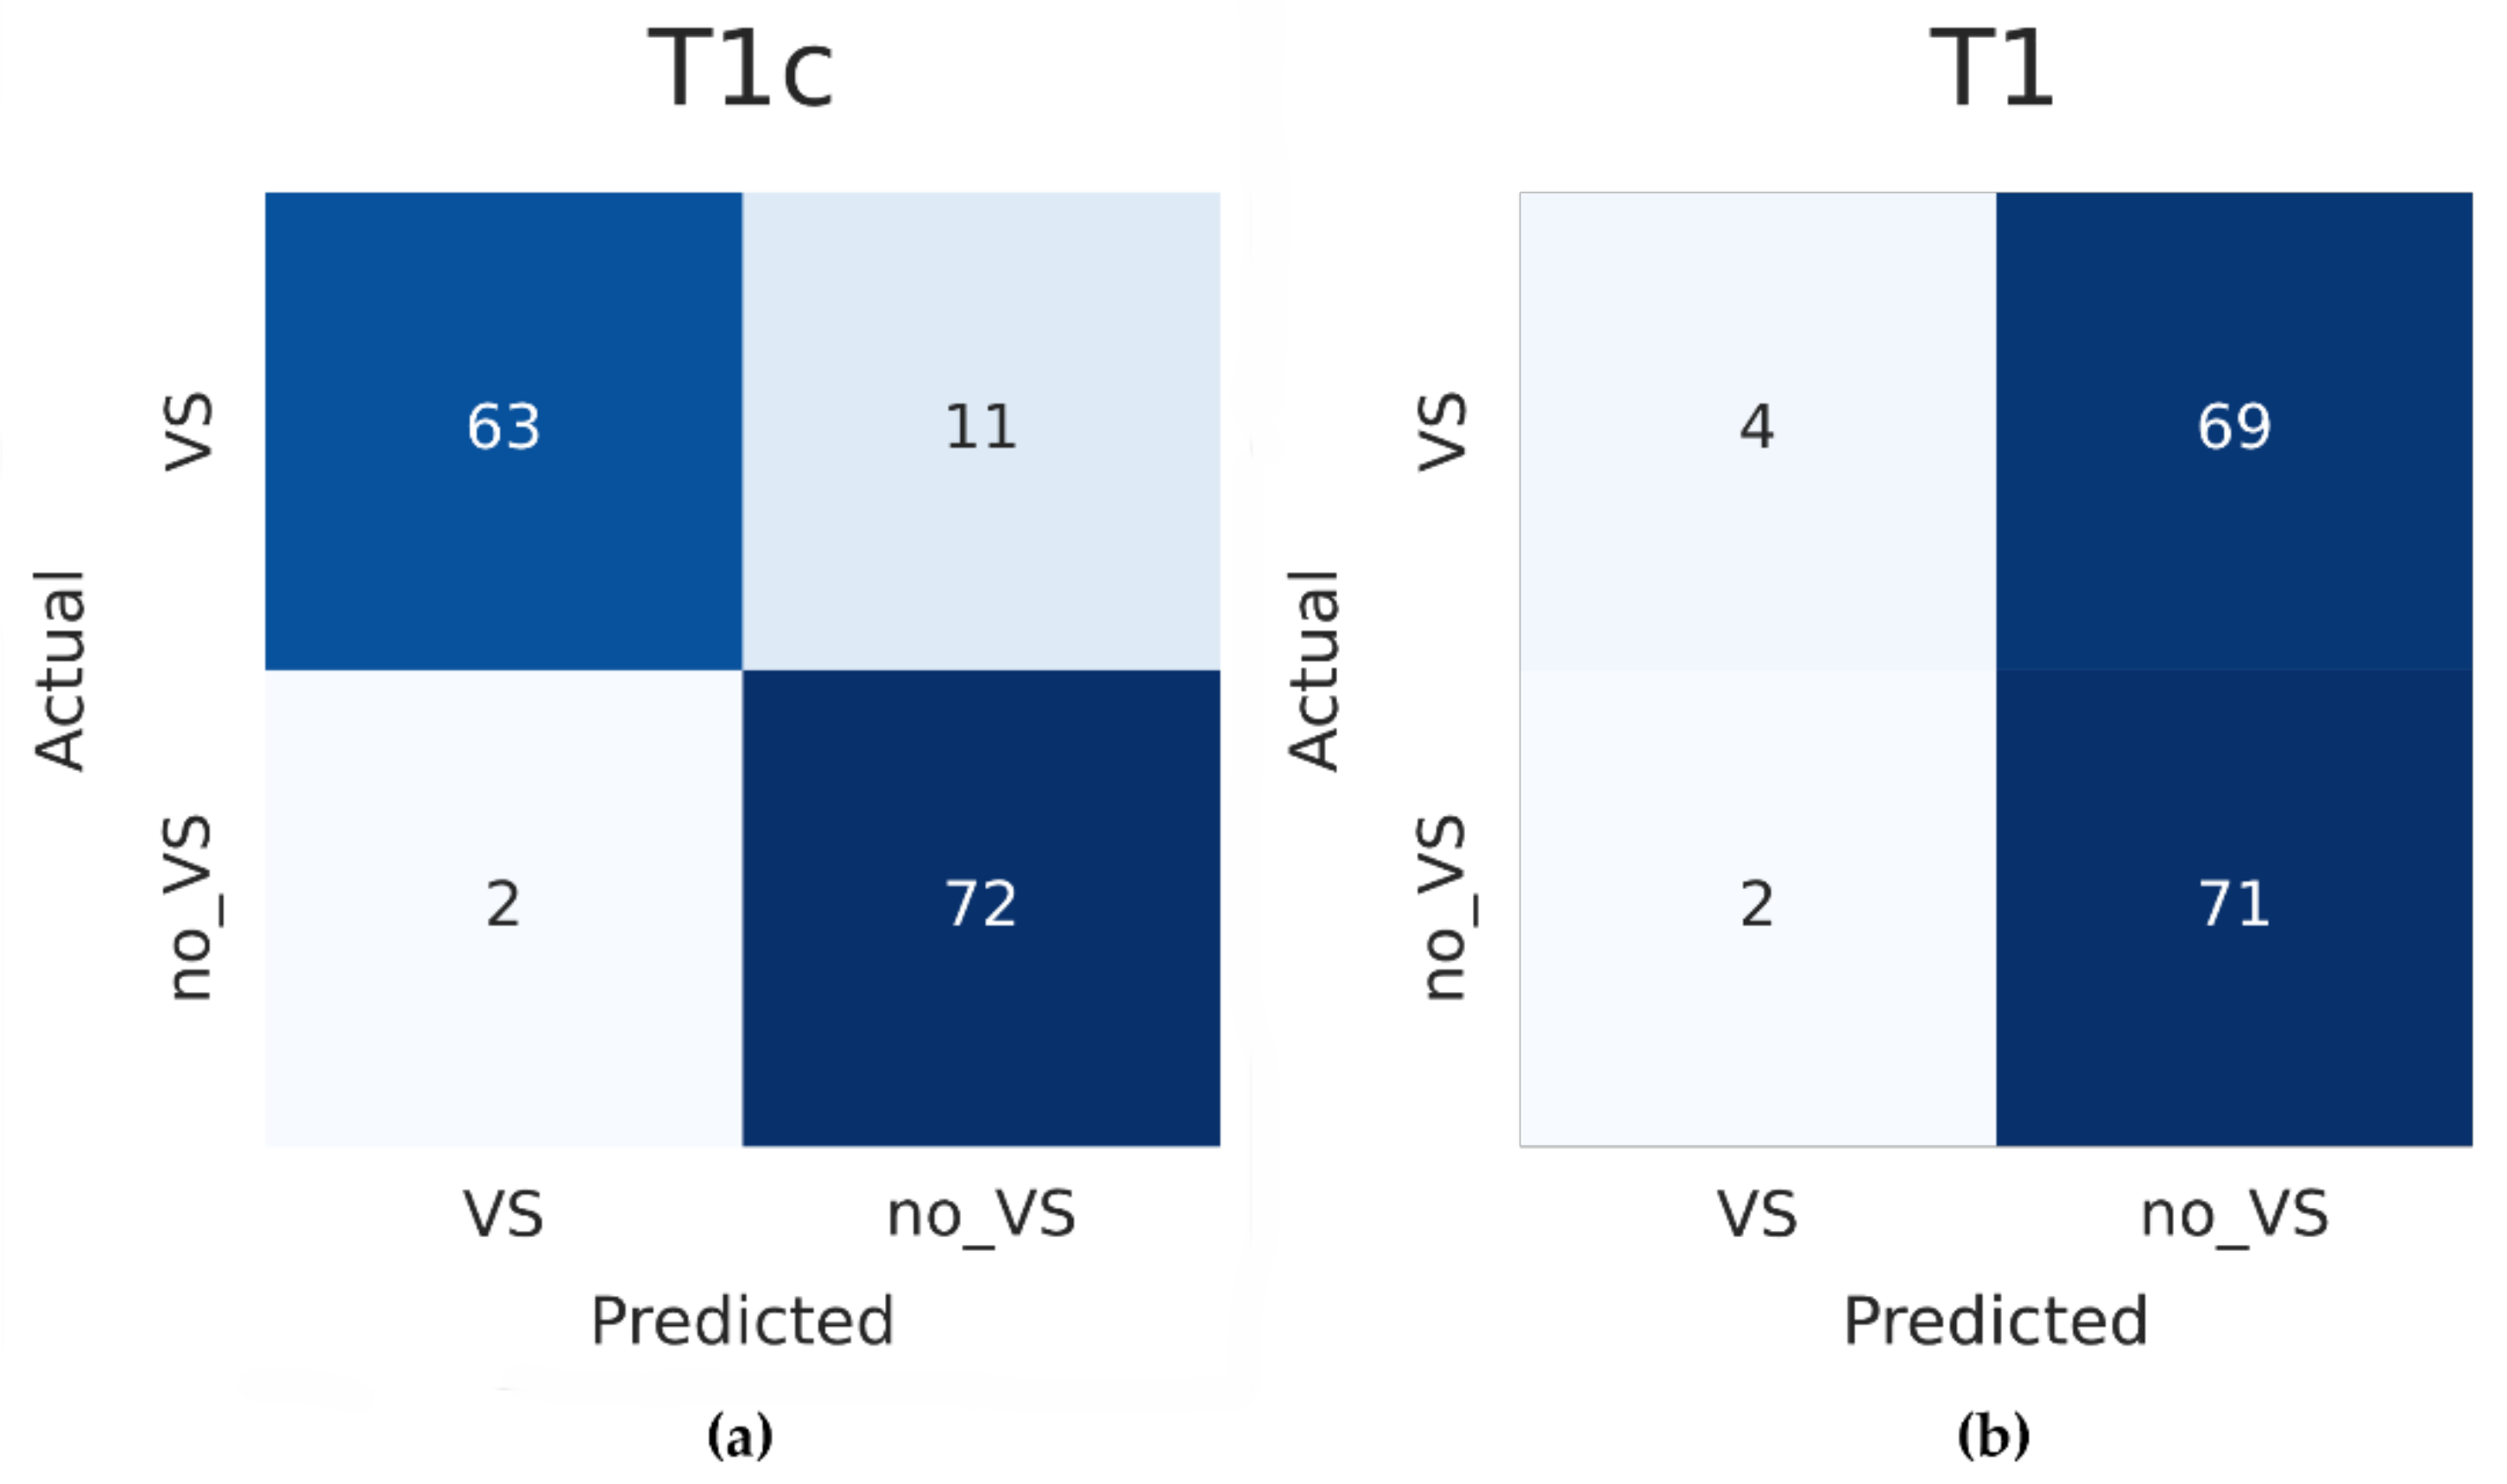
| External T1c validation | 0.912 (95% CI 0.866–0.958) | 0.851 | 0.973 | 0.906 |
| External T1 validation | 0.514 (95% CI 0.433–0.595) | 0.055 | 0.973 | 0.101 |
Publisher’s Note: MDPI stays neutral with regard to jurisdictional claims in published maps and institutional affiliations. |
© 2022 by the authors. Licensee MDPI, Basel, Switzerland. This article is an open access article distributed under the terms and conditions of the Creative Commons Attribution (CC BY) license (https://creativecommons.org/licenses/by/4.0/).
Share and Cite
Koechli, C.; Vu, E.; Sager, P.; Näf, L.; Fischer, T.; Putora, P.M.; Ehret, F.; Fürweger, C.; Schröder, C.; Förster, R.; et al. Convolutional Neural Networks to Detect Vestibular Schwannomas on Single MRI Slices: A Feasibility Study. Cancers 2022, 14, 2069. https://doi.org/10.3390/cancers14092069
Koechli C, Vu E, Sager P, Näf L, Fischer T, Putora PM, Ehret F, Fürweger C, Schröder C, Förster R, et al. Convolutional Neural Networks to Detect Vestibular Schwannomas on Single MRI Slices: A Feasibility Study. Cancers. 2022; 14(9):2069. https://doi.org/10.3390/cancers14092069
Chicago/Turabian StyleKoechli, Carole, Erwin Vu, Philipp Sager, Lukas Näf, Tim Fischer, Paul M. Putora, Felix Ehret, Christoph Fürweger, Christina Schröder, Robert Förster, and et al. 2022. "Convolutional Neural Networks to Detect Vestibular Schwannomas on Single MRI Slices: A Feasibility Study" Cancers 14, no. 9: 2069. https://doi.org/10.3390/cancers14092069